Cite report
IEA (2025), Unlocking Ukraine’s Hydrogen Opportunity: A Roadmap, IEA, Paris https://www.iea.org/reports/unlocking-ukraines-hydrogen-opportunity-a-roadmap, Licence: CC BY 4.0
Report options
The hydrogen opportunity
Highlights
- Ukraine has 18-38 Mtpa of technical renewable hydrogen potential, though economic constraints would result in lower potential. Most potential is in regions with scarce water resources and competition from other industrial activities. Domestic demand for use for steel and fertilisers could reach 2.2 Mtpa, if pre-invasion capacity is restored, and the government target has set a target of 7.2 Mtpa of production by 2050. Most hydrogen production projects proposed prior to the invasion are close to the border with the European Union.
- Ukraine has a technical potential for solar PV and onshore wind equivalent to 9‑14 times its pre-invasion electricity demand and 2‑4 times its final energy demand. Half of this potential is in regions that are occupied or heavily mine-contaminated. The realisable economic potential is much lower, especially considering the current high cost of capital. Ukraine has a larger renewable resource capacity than Germany (a potential importer of hydrogen derivatives), but smaller than Morocco (an alternative supplier to Europe). The high cost of capital in Ukraine could offset lower costs from higher capacity factors.
- If repurposed, existing gas pipelines to the European Union could transport nearly 33 Mtpa of hydrogen (80% through Slovakia). Most of the capacity is now available. Ukraine also has 13 underground gas sites which could store 2.4 Mtpa of hydrogen; one site near the EU border has a capacity of 1.2 Mtpa. There are two initiatives exploring corridors to the European Union (1.5 Mtpa and 2.4 Mtpa) under development, but they currently lack off-taker involvement.
- Producing 2.5 Mtpa of hydrogen could generate annual revenues in the order of USD 18-22 billion from steel exports and exports by pipeline. It could also create up to 100 000 jobs, but 70% of these would be temporary positions related to construction, 50% are in equipment manufacturing, which could be located abroad, and 80% are related to constructing renewables rather than electrolysis. Focusing on electrification would therefore provide most potential job opportunities.
- Producing 2.5 Mtpa of hydrogen requires an investment of USD 85-90 billion for renewables and electrolysis. This is equivalent to 50% of the national gross domestic product in 2024 and 45-65% higher than the investment needed to reconstruct the entire energy system after the war. If this investment is funded with a cost of capital of 15%, interest payments could reach USD 165-175 billion (in nominal terms) over the entire lifetime of the assets.
Introduction
This chapter is forward-looking, highlighting the potential barriers and opportunities for the development of renewable hydrogen. This includes the potential for production and export and how it compares with potential importers and competitors, and potential demand, including for steelmaking, as well as water constraints that could be faced. In the power sector, we assess the renewable potential and quality. Turning to infrastructure, we assess the capacity that existing pipelines and underground storage could have if repurposed for hydrogen, as well as some of the pipeline corridors to Europe that have been proposed. From the macroeconomic perspective, we discuss the potential revenues and jobs created by hydrogen production. Lastly, we assess the investment needs for a fully mature market.
Hydrogen
Supply
Ukraine’s hydrogen production technical potential ranges from 18-38 Mtpa. The renewable potential has a high uncertainty depending on the criteria used for assessment1 A potential of 1 300-2 300 TWh/yr would be enough to produce about 26-46 Mtpa of hydrogen2. However, some of the potential will need to be used to satisfy domestic demand for electricity. Electricity demand prior to the invasion was about 150 TWh/yr. As the energy system decarbonises, the share of electricity will increase, especially as more efficient technologies are used. Assuming that national electricity demand grows at the same rate as global demand in a world moving towards a net zero emissions system, demand would reach about 405 TWh/yr. This would reduce the renewable potential available for hydrogen, but would still be enough to produce 17.8-37.5 Mtpa. This would be the upper limit and does not take into account the resource quality (i.e. capacity factors), which influence the hydrogen costs and the economic potential. Nor does it consider the geographical location and additional transport costs to reach the border.
A number of hydrogen projects had been proposed before Russia’s full-scale invasion, but all were in the early stages and need reassessment. There were 13 proposed hydrogen projects, adding up to nearly 2 GW in their first phase (75% of this capacity came from the H2EU+Store project) and an ultimate capacity of more than 13.5 GW. Most of the projects were targeting hydrogen as a product, with three of them considering the possibility of also producing ammonia. Five projects targeted the local market in combination with exports, while the rest were export-oriented (or had not published relevant data). Most were targeting the use of pipelines to transport hydrogen, with some of the smaller projects considering road and rail transport. One of the largest projects was close to the Kakhovka dam that was destroyed in June 2023, and another, which is aiming for up to 10 GW of electrolysis, is near the war frontline and bordering occupied regions.
Proposed hydrogen projects in Ukraine before Russia’s full-scale invasion
|
Name |
Electrolyser capacity (MW) |
Investment (EUR mn) |
Product |
Transport |
|---|---|---|---|---|
| Zakarpattia | Phase 1: 100 Vision: 1 500 |
Phase 1: 300 | H2 | Pipeline, road |
| Reni | 2028: 100 2030: 200 |
300-400 | H2, NH3 | Pipeline, ship |
| *Kakhovka / River Wind | Phase 1: 200 Vision: 1 100 |
Phase 1: 400 Phase 2: 2 000+ |
H2, NH3 | Pipeline |
| Danube Hydrogen Valley | Phase 1: 50 Vision: 3 000 |
Phase 1: 100 Vision: 14 000 |
H2, NH3 | River transport |
| H2 Production Sumy | 110 | 280 | H2 | Pipeline, rail |
| Transcarpathian green hydrogen | 30-35 | 130 | H2 | Pipeline, road, rail |
| Kyiv green data centre | 20-30 | 125 | H2 | Pipeline |
| European Galicia | Phase 1: 50 Vision: 200 |
400 | H2, NH3 | Rail, road |
| Lyiv Region | 17.5 | 70 | H2 | Pipeline |
| Green hydrogen industrial cluster | 8.5 Vision: 10 000 |
25 | H2 | Pipeline (H2, NH3), LOHC |
| Vinnytsia and Chernivtsi Regions | Phase 1: 10 Phase 2: 87 |
Phase 1: 14 | H2 | - |
| H2EU+Store | Phase 1: 1 500 Vision: 80 TWh |
105 | H2 | Pipeline |
| Salt for Life | - | 278-508 | H2 | Pipeline |
Notes: H2 = hydrogen; NH3 = ammonia; LOHC = Liquid Organic Hydrogen Carrier. Projects with an asterisk are in occupied regions, and/or in regions with severe damage due to attacks, and/or near the frontline.
Source: IEA analysis based on DENA (2021)
Two hydrogen valleys, in Zakarpattia and Reni, are the most advanced projects. The valley in Zakarpattia is less than 10 km from the border with Hungary (west). Initial electrolyser capacity is 100 MW, fed by 120 MW of solar PV and 80-160 MW of wind, which would be used to produce 105 ktpa. The full electrolyser capacity is expected to be 1.5 GW. The investment foreseen for the first phase is EUR 300 million with operation due to start in 2035. Targeted end uses include industrial feedstock, energy and road transport. The other hydrogen valley is in Reni, a city on the border with Romania (southwest). This project targets 100 MW of electrolysis by 2028, powered by 120 MW of solar PV and 80 MW of wind. A second phase would see an expansion to 200 MW by 2030, with potential for 3 GW later. In May 2024, the UK government funded a feasibility study through the InnovateUkraine programme, which will look at the construction of the renewable assets, the electrolyser and the pipeline, and assess the potential for underground storage in salt formations.
Hydrogen production from nuclear energy could, at best, reach production costs of USD 3.6-5.3/kg by 2040, subject to multiple conditions. Since nuclear represents more than half of the electricity generation in Ukraine, it could also provide a potential pathway for hydrogen production. In addition, at COP 28, Ukraine endorsed a declaration to triple nuclear energy capacity by 2050. However, Ukraine has not built any nuclear reactors since 2004, which means there is a lack of domestic know-how regarding plant construction and there are no recent cost estimates. In 2021, an agreement between Westinghouse (a nuclear technology provider) and Energoatom (the state-owned enterprise operating the nuclear plants) put the total cost of the construction of four new reactors with a total capacity of 4.6 GW at USD 30 billion. This results in a CAPEX intensity of nearly USD 6 500/kW. This roughly corresponds to the current capital costs of nuclear plants in the European Union. Costs could come down with experience, technology innovation and policy support. Assuming the costs in Ukraine follow a similar trajectory to in the European Union, costs could reach USD 4 500/kW by 2040. With the addition of fuel and operating costs, the levelised cost of electricity would be USD 75-110/MWh, which is equivalent to USD 3.6‑5.3 per kilogramme of hydrogen (H2). Achieving this cost would require at least three conditions to be fulfilled. First, that plants are constructed on budget and on time, which has not been the case for recent nuclear plants constructed outside China, which have seen costs of USD 6 000-16 000/kW and construction times of 8-16 years. Second, a cost of capital of 4-8%, which is one- to two-thirds lower than the pre-war WACC. Third, that the 30% capital cost reduction materialises.
Demand
Potential domestic hydrogen demand from industrial applications could reach 2.2 Mtpa. Before Russia’s invasion, hydrogen demand was nearly 1 Mtpa (see Chapter “Taking stock of the effect of war”). This was used mainly for ammonia production and, to a smaller extent, for oil refining. Steel production was 22 Mtpa. If all such production were restored using direct reduction of iron, the corresponding hydrogen demand would be 1.3 Mtpa3. This corresponds to about 10% of the renewable hydrogen potential. There is also a geographical correlation between the sites where industrial activity was highest before the invasion and the regions with the highest renewable potential and capacity factors.

Direct reduction of iron with hydrogen could leverage Ukraine’s iron ore reserves. Ukraine holds about 3.5% of global iron ore reserves, which have a lower iron content4 (about 35%) than the global average (45%)5. In contrast, direct reduction of iron with hydrogen (H2-DRI) requires high-grade iron ore, since the process does involve melting or refining, which is the way impurities are usually removed. High-grade iron ore of 67% is therefore needed. At the same time, iron ore must be in the pellet form for use in H2-DRI. Only about 4% of the global iron ore exports in 2020 were in pellets with a high iron content. The iron content is important because it can affect the efficiency and operation of the electric arc furnace, the degree of metallisation and the mechanical properties of the iron oxide produced, among other factors. Some of the solutions include the use of fluidised bed technology (which could avoid the need to use pellets), an additional smelting unit to remove impurities via slag production, and increasing the iron content of the ore through a process called beneficiation. Either way, the lower iron content of Ukrainian iron ore could require two additional steps (pelletising and beneficiation), which translate into additional cost. The beneficiation premium can be about USD 7-8/t for every percentage point of increase in iron content, resulting in about USD 40/t for going from the global average of 62% to the 67% required. This is significant, considering that the average price of iron ore was USD 90-140/t in 2023-2024. Several companies have plans to invest in pellets and concentrate plants.
Proximity to the large demand from the European Union could drive hydrogen development. Hydrogen demand in the European Union was nearly 8 Mtpa in 2023. This is expected to increase to 15-73 Mtpa6 by 2050, with the large range reflecting differences in the level of ambition, technology portfolios and assumptions relating to reliance on specific levers. At the same time, even with the European Union’s large renewable potential, imports will most likely be needed. Ukraine has the advantage of being able to export by pipeline, which has a lower transport cost than shipping for distances shorter than 5 000 km. Legislation already in place represents a demand of about 2 Mtpa for low-emissions hydrogen7. At the same time, the European Union had a real steel demand of 135-150 Mtpa in the 2014-2023 period, with imports of 20-30 Mtpa. While the bloc also exported 16-29 Mtpa over the same period, the net import was 9-12 Mtpa in 2022-2023. For reference, 5 Mtpa of steel demand would require about 0.3 Mtpa of hydrogen, which would in turn require 3 GW of electrolysis8.
The EU Carbon Border Adjustment Mechanism (CBAM) could trigger additional hydrogen demand. The CBAM is being phased in from 2026 to 2034 and it currently covers six products including hydrogen, fertilisers, and iron and steel. This means that any imports of these products to the European Union will be subject to the carbon price, thereby providing an incentive for decarbonisation of the imports. For Ukraine, this represents a mechanism to close the cost gap for the renewable hydrogen routes. For steel, in 2021, about a third of Ukraine’s steel exports were to the European Union. For a fixed capital cost and energy price, the cost differential between the renewable route (H2-DRI) and the conventional route (blast furnace) is a function of the CO2 price and the cost of capital. The lower the cost of capital by using de-risking instruments (see Chapter “Unlocking the opportunity – A roadmap for action”), the lower the CO2 price needed to close the cost gap. In the past 3 years, the EU Emissions Trading System (ETS) price has been at EUR 60-100/t CO2, which means the cost of capital would need to be 2-7%. Looking further ahead, the CAPEX for the renewable route will decrease through deployment and learning for both the electrolyser and the DRI plant, and the CO2 price is expected to increase as the emissions reduction accelerates. Once Ukraine’s EU accession process has been completed, the domestic ETS price should follow the same cost trend, so the gap would not be closed by the CBAM, but by the domestic ETS.
Ukraine could produce the equivalent of 20-80% of its oil demand in the form of synthetic oil, if the domestic biogenic CO2 potential is used. Ukraine has a biomethane potential of 6-22 bcm9. Biomethane is produced by separating the CO2 from biogas to leave a high purity (> 95%) stream of methane. The original biogas typically has a CO2 content of 45-75% depending on the feedstock and process, but that biomethane potential could be associated with 7-25 Mtpa of CO2 production. If used for synthetic oil production by combining it with renewable hydrogen (through the Fischer Tropsch process), that would be enough to produce 80-292 PJ/yr, which is approximately equal to 20-80% of the 352 PJ/yr of the oil demand in Ukraine in 2021. This could also be used for methanol production, providing an opportunity to establish a new industry, given that there was no domestic methanol production before the invasion.
Water
Water availability for hydrogen production could be most critical in Donetsk, Kherson and Odesa. Both water resources and withdrawal prior to the invasion have large regional differences. Most of the water resources are in the north10, while most water withdrawal is in the south. Therefore, the ratio between withdrawals and average resources is the worst (40-80%) in the south and southeast regions, where most of the industrial activity was located before Russia’s invasion (and where the best renewable resources are). This reaches more than 80% in the industrial region of Donetsk, where the city of Mariupol is located (which has been completely destroyed by the war). Hydrogen production alone could account for more than 10% of all the water resources in the Donetsk, Kherson and Odesa oblasts. This is without considering competing uses for the water, which are most critical in southern regions – the latter three oblasts are where the most water is withdrawn today (nearly 3 800 million m3).
Climate change could exacerbate water stress in Ukraine. The potential risks associated with climate change include heat waves, flooding and (extended) droughts. The number of hot days, duration of the heat waves and the heat load have already increased in Ukraine. As much as 30% of the national territory is exposed to flooding risk, and the area of (very) dry zones has increased by 7% since 1991, and now covers almost a third of the national territory. In the future, river discharge is expected to decrease in most of the river basins by 2070-2100, even in a scenario in which global temperature increases are limited to 1.5-2°C, with the peak of spring run-off shifting to earlier months, and lower run-off in summer. Similarly, precipitation could increase up to 10% on average in a 1.5-2°C scenario, with more precipitation in winter. Southern regions (where most of the renewable potential is) could experience 12-14% lower precipitation in a scenario with a temperature increase of more than 2°C. Heat waves, heavy precipitation, flooding and drought are all expected to increase.
Realising Ukraine’s full hydrogen potential could consume more water than was consumed by all industry sectors prior to the invasion. Producing 19.5 Mtpa of renewable hydrogen would require using nearly 1 150 million m3 of water11. Total water resources in Ukraine are nearly 175 000 million m3, out of which 97% is formed by surface river run-off and nearly 30% originates from within the country’s borders. Water supply is an issue for Ukraine, with the average resident having access to 1 280 m3 of annual local run-off, which is below the threshold established by United Nations Development Programme to define water stress (1 700 m3 per capita). The 1 150 million m3 used for hydrogen would be more significant when compared to water withdrawal (instead of resources), which was 9 220 million m3 in 2021, of which 27% was for the energy sector and 11% for industry.

Share of water resources used for hydrogen when realising the entire potential
> 10%
4% - 10%
1% - 4%
0% - 1%
Presence of landmines
IEA. CC BY 4.0
Power
Renewable potential
Ukraine has 1 300-2 300 TWh/yr12 of wind and solar technical potential, with most of it coming from wind. As a reference, power generation before the full invasion was nearly 150 TWh/yr and the primary energy supply was nearly 1 000 TWh/yr. About one-third of the potential is in occupied territory. Additionally, Ukraine also has another nearly 1 000 TWh/yr of offshore wind potential in territorial and inland waters. The range of potential estimates is wide depending on the criteria used and the type of potential (technical vs. economic), and also on the land exclusion zones and criteria. The annex contains a collection of studies estimating the potential for solar PV and onshore wind, while we use our own estimate for the supply cost curve for renewable hydrogen.

TWh/yr
Solar PV
Onshore wind
100
50
10
IEA. CC BY 4.0
Land use for agriculture might be subject to additional constraints. Two-thirds of the land area in Ukraine is used for agricultural purposes. To be able to use privately owned land for renewables, any opportunity costs related to alternative land uses would need to be overcome. In parts that are state-owned, approval by different levels of the government would be needed. In addition, nearly 56% of Ukraine’s land area is covered by black soil13 most of which has a special status as “particularly valuable land”. This means it has special legal protection and there are restrictions on changing its purpose (including for renewable generation), including a need for additional compensation. Despite this, a law passed in 2024 aims to simplify land conversion from agricultural uses to facilitate the country’s reconstruction.
Nearly half of the renewable technical potential is in oblasts that are either currently occupied or heavily contaminated with land mines. An additional step of surveying and demining would therefore be required before any renewable projects are constructed – adding time to the process. There is not only an immediate security risk in these areas, but the overall risk profile is higher, given that these areas have experienced the most damage due to attacks. In many cases, pre-existing infrastructure has been completely destroyed and additional efforts and investments would be needed to remove the debris. The oblasts close to the border with the European Union have the smallest potential of all, and additional transport would be needed if the resources in the southeast are exploited. For example, the distance from the area around Mykolaiv, where a lot of the renewable plants are today, to the Polish border, is about 800 km. This is therefore almost double the distance from the industrial centres of West Germany. The cost premium for covering this distance could be small if existing infrastructure can be repurposed, but it would still increase the transport cost.
The average quality of renewable resources in Ukraine is better than Germany but worse than in the European Union’s other neighbouring regions. A large part of the business case for hydrogen in Ukraine is based on exports. Most of these exports are expected to go to the European market, given its proximity and the possibility to use existing pipelines. Germany is the largest hydrogen consumer in Europe, so comparing it with Ukraine allows for an assessment of competitiveness. For solar PV, Ukraine has average full load hours about 11% higher than Germany. In terms of amount of energy, Ukraine has nearly ten times Germany’s potential14 Morocco, which is an alternative exporter of hydrogen to Europe, has more abundant solar resources with higher quality. The average full load hours in Morocco are 45% higher than in Ukraine and the total potential is more than three times higher. For onshore wind, the story is similar: Ukraine has average full load hours 17% higher than Germany, but Morocco has nearly 18% more full load hours than Ukraine. In terms of potential, Morocco and Ukraine have nearly 7- and 10-times Germany’s potential, respectively, with the big difference that more than 60% of Morocco’s potential has more than 2 630 full load hours (30% capacity factor) while only about 36% of Ukraine’s potential is in this range.
Cost
There is a cost difference of 30-50% between Ukraine’s least expensive and most expensive hydrogen. The cost of hydrogen production is defined by the cost of capital, the capital cost of the assets and the utilisation of those assets. The first two parameters will change over time, while the last one is constant (for renewables). Even in 2035, by which time capital costs are expected to have come down, the least expensive hydrogen Ukraine can produce costs slightly more than USD 3.5/kg. This is assuming a cost of capital of 8%, which would be lower than the pre-war level for renewables. It also assumes that renewable resources with the lowest cost would not be available for hydrogen, and would instead be devoted to direct electricity use (which is more efficient). As the best and cheapest resources are already being used, cost increases by USD 0.1-0.16/kg for every additional Mtpa of hydrogen produced, resulting in a cost premium of 30-50% for the most expensive resources. A different technology learning curve and cost trajectory could shift this profile, but the cost of capital can have a bigger influence than CAPEX. For reference, the technical hydrogen potential for Ukraine of 18‑38 Mtpa15 is much larger than pre-war domestic demand and almost double the European Union’s hydrogen demand in 2023. It would still be equal to or lower than the projected 2050 demand, for which most scenarios fall within 15‑73 Mtpa.
Supply cost curves for renewable hydrogen based on hybrid onshore wind-PV configurations, 2035
OpenThe lowest hydrogen costs are achieved in areas that are today occupied, mine-contaminated or extensively damaged. The southeast of Ukraine combines the best solar and wind resources, which allows for the lowest hydrogen production costs. These areas also had high industrial activity before Russia’s full-scale invasion, which could provide opportunities for hydrogen use in the chemicals or steel sectors. However, these areas are also at the war front at present and have experienced the most extensive damage (see Chapter “Taking stock of the effect of war”). The alternative of using resources that are not in occupied areas today could result in a cost premium of at least 25%.
Levelised cost of hydrogen for Ukraine based on hybrid onshore wind-solar PV configurations, 2035
Open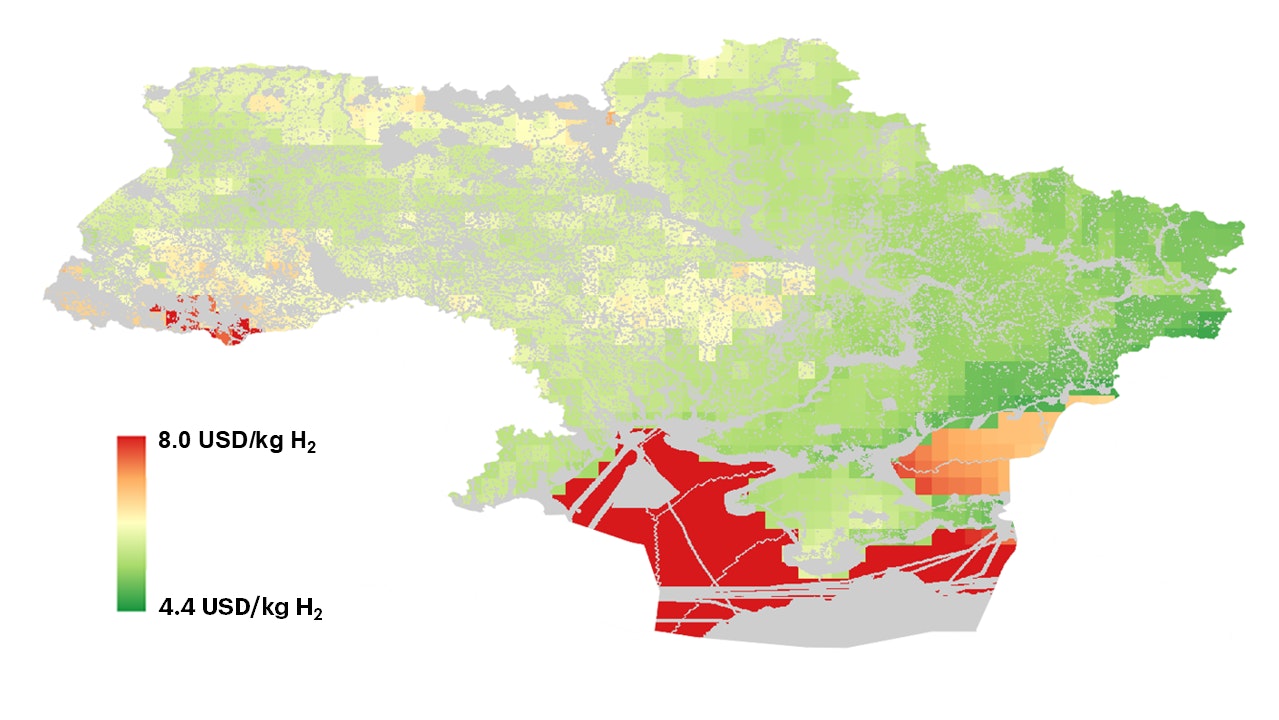
Hydrogen imports from Ukraine to Germany could be cheaper than alternatives but the WACC remains a major challenge. The average resource quality of onshore wind is higher in Ukraine than in Germany and it also has lower capital cost. In 2023, the capital cost of onshore wind in Ukraine was USD 1375/kW, while in Germany it was about USD 1750/kW. This means that if Ukraine were to reach the same WACC as Germany16 the production costs could be nearly 20% lower. When adding transport, the cost differential falls to 14%, taking advantage of a large share of the transport being through repurposed natural gas pipelines (see next section). However, a WACC premium of 3-3.5% would close this cost gap. This is much lower than the differential of more than 10% prior to the invasion, and much lower than the current WACC difference (see Chapter 1. “Taking stock of the effect of war”). Even when using de-risking mechanisms to mitigate most of the war risks (e.g. political risk insurance – see Chapter 3. "Unlocking the opportunity - A roadmap for action"), it might be difficult for Ukraine to reach the low WACC levels seen in Germany. The breakeven WACC premium would be lower if, for example, a smaller pipeline was used, or if the share of repurposed pipelines were lower. The production costs of other potential exporters by pipeline are comparable to those of Ukraine and other factors like diversification, geopolitics and certainty of supply might play a larger role in defining the import mix.
Hydrogen production and transport costs to Germany, 2035
OpenGas
Existing gas interconnection pipelines to the European Union have a technical capacity equivalent to nearly 33 Mtpa17 Nearly 80% of the cross-border capacity18 is to Slovakia (26.3 Mtpa), which has multiple pipelines including one of 1 400 mm and one of 700 mm. Hungary is second with nearly 4.3 Mtpa of capacity and a virtual interconnection point (VIP), which means there are multiple parallel pipelines available that are managed as a single trading point. Romania has multiple pipelines (one of 1 000 mm and one 700 mm), which together would have a capacity of 1.7 Mtpa. Interconnection with Poland is via a VIP with a capacity of 1.1 Mtpa. To provide a reference for some of these numbers, 1 Mtpa of hydrogen demand would be equivalent to about five large-scale ammonia plants and nine steel plants19. The total primary steel (hot metal) production in Slovakia, the Czech Republic, Austria and Germany, which could be either transit or target countries for pipeline corridors, would be equivalent to about 2.3 Mtpa of hydrogen demand. The current hydrogen demand for ammonia production in these countries is about 0.5 Mtpa. If all the existing pipelines could be repurposed for hydrogen, cross-border capacity would not be an issue since there are multiple parallel pipelines and capacity is higher than the renewable potential. The capacity may not all be available, since it could also be used for biomethane exports. In 2024, biomethane exports were estimated to be 0.1 bcm (in comparison to a network capacity of 146 bcm). The potential production by 2030 could be 1 bcm, and the total potential is 6-22 bcm.
Gas
Pipeline export capacity to the European Union
33 Mtpa
export capacity to the EU
2.4 Mtpa
hydrogen storage capacity
Ukraine could store about 2.4 Mtpa of hydrogen in existing underground sites, but these require technology de-risking. Ukraine has 13 underground storage sites with a working capacity of 32 bcm. Hydrogen has a lower molecular weight and density than methane, which means the storage capacity is reduced by nearly 75% when storing hydrogen. This means that the storage capacity is 2.4 Mtpa of hydrogen. Two of the sites are aquifers and the rest are depleted gas fields. Gas fields present several challenges for hydrogen storage. They are permeable (which can result in hydrogen losses to the reservoir), can contain contaminants or by-products from reactions with the reservoir (which need removal), and are the least flexible of underground storage options. On the other hand, they typically have a large capacity and are more suitable for hydrogen storage than deep saline aquifers. More than 50% of the storage capacity is in a single site close to the border with the European Union in the West. This is far from the sites with the largest renewable potential, but might be better from the perspective of security of supply, since export from the storage would not depend on domestic pipelines.
A proposed 1.5 Mtpa corridor to the European Union, using existing pipelines, is under evaluation, but off-takers are needed. The Central European Hydrogen Corridor (CEHC) would have a length of 1 350 km, crossing Slovakia, the Czech Republic and Germany. The initial maximum capacity is expected to be nearly 1.5 Mtpa20 with final investment decision (FID) in 2028 and commercial operation after 2030. The estimated investment is EUR 1-1.5 billion, which is possible given that more than 90% (by length) will use repurposed pipelines. Pipeline diameters vary from 900 mm to 1 400 mm, with the smallest pipelines in Slovakia. Transmission System Operators (TSO) have been closely involved, but there are no off-takers for the demand. The project was included in the sixth list of Projects of Common Interest (PCI) of the European Union published in November 2023. This classification provides the benefit of accelerated planning and permitting, streamlined environmental assessment processes and increased visibility for investors. In January 2025, the Ukrainian gas TSO signed a Memorandum of Understanding (MoU) with other TSOs and companies involved in the corridor, agreeing to support its development and committing to complete a feasibility study for retrofitting the pipelines within 12‑18 months.
There is another corridor to the European Union through Austria, with a potential capacity of 2.4 Mtpa by 2050, but it also lacks off-takers. The “H2EU +Store” project was launched by an energy storage company in Austria (RAG Austria) and a renewable developer in Ukraine (Eco-Optima). The route would cross Slovakia, Austria and Germany, largely relying on repurposed gas pipelines. The project is divided in three phases targeting a capacity of 75 ktpa by 2030, 1.2 Mtpa by 2040, and 2.4 Mtpa by 2050. Project participants are mostly TSOs and companies working on gas supply, but there are no potential off-takers. A feasibility study was due to be finalised by the end of 2024.
Macroeconomic factors
The annual revenue potential from producing 2.5 Mtpa of hydrogen, with 50% used for steelmaking, could be in the order of USD 18‑22 billion. A production capacity of 2.5 Mtpa reflects the capacity of the pipeline corridors being explored, represents using about 12.5% of the national renewable potential, and is in the range considered by the government in the draft hydrogen strategy for 2035-205021 The revenue from hydrogen export would be dependent on what buyers are willing to pay, where the alternative is either local production or import from another country. Assuming the hydrogen price is around USD 3‑4/kg22 exporting half of the potential production as hydrogen through pipelines could generate annual revenues of about USD 3‑5 billion. Steel export would require additional investment, but it would also lead to higher value added, and potential revenues in the order of USD 15‑18 billion. For reference, steel exports from Ukraine fluctuated in the range of USD 7-15 billion in the decade before the war.
Deployment of renewables and electrolysis capacity for 2.5 Mtpa for can create up to 100 000 jobs. A gradual deployment of the capacity over 10 years (which is optimistic from the perspective of job creation) would require up to 100 000 people towards the end of this period. As a comparison, in 2021, prior to Russia’s invasion, the entire renewable sector employed about 40 000 people, of which nearly 45% were employed in the solar PV industry. This was about 10% of the labour force for the entire energy sector, which was estimated to be 400 000 people in 2018. By 2023, the labour force for renewables had halved to 19 000 people, with only 30% working in wind and solar PV. In 2021, nearly 565 000 people were employed in the steel sector, of which 15% joined the army once the war started. Labour availability may be an issue, not only during the ramp-up phase of construction, but also once experience with large-scale facilities has been developed. Even in a mature market like the United States, where there are about 360 000 workers in the solar industry, 94% of construction employers report some difficulty in finding qualified workers. In Germany, there are skills gaps in 190 relevant professions and vacancy periods of six months were reported for wind technicians.
Direct and indirect job creation from deploying 2.5 Mtpa of hydrogen over 10 years
OpenOver 70% of the jobs are temporary and associated with construction and manufacturing. For solar PV and onshore wind, the number of jobs in operation and maintenance are at least an order of magnitude smaller than the jobs associated with the manufacturing and construction of the assets23. This means that most of the jobs will be temporary, i.e. only for the construction phase, with a fraction of the workforce (with different skills) needed afterwards. The number of jobs created in electrolysis is highly uncertain, but assuming the operation is similar to basic chemical production, there would be around 1.6 jobs for every USD 1 million of output, which would lead to about 12 500 jobs for operation of the electrolysers once full capacity has been reached.
Nearly 35% of the jobs are in manufacturing alone, which will most likely be located abroad. More jobs are created for the manufacturing of components for onshore wind turbines than for their construction, and most of Ukraine’s renewable potential is in the form of onshore wind (see Chapter "Taking stock of the effect of war"). The share of trade in global deployment is about 20% given that the components are bulky and heavy. Europe is a mature market, with over 80% of the nacelles, blades and towers for onshore wind being manufactured domestically. Ukraine could benefit from its proximity to this leading market and import components from Europe.
More than 80% of the potential jobs are from renewables rather than electrolysis. Manufacturing and construction of the electrolyser could be in the order of 1 350 jobs per GW, while this could be 4-5 times higher for onshore wind. This is considering an optimistic scenario for job creation, while other estimates are closer to 500 jobs per GW. Operating the electrolysers is much more complex and labour-intensive than operating the renewable assets, but given the larger share of labour needed for manufacturing and construction of the renewable assets, most of the jobs are still associated with the renewable assets rather than electrolysis. As such, if job creation is a major policy goal, the greatest gains can be made by pursuing the expansion of renewables, which will be needed to realise the electrification plans of the long-term energy strategy and which would also result in a higher system efficiency.
The number of jobs to be created is highly uncertain, depending on the methodology used and specific assumptions. A recent review of 121 studies on job creation across all power generation technologies found that for the construction and installation of solar PV, the difference between the studies with the least and most jobs created was a factor of 5.5, decreasing to a factor less than 2 for the manufacturing stage. For onshore wind, those two numbers were roughly 2 and 3, respectively. For hydrogen, the uncertainty across literature is higher, given that studies are unclear regarding the scope (parts of the supply chain that are covered), type of jobs (direct and indirect), and stage (construction vs operation). Most studies with a comparable scope would create between 2 500 and 5 000 direct and indirect jobs in manufacturing and construction per GW of electrolyser capacity. Another uncertainty is introduced by regional differences for wages and investment, and how these affect the specific job multipliers for Ukraine. Given these uncertainties, the numbers above should be taken as an indication of the order of magnitude rather than an accurate estimate of the number of jobs created.
Most of the jobs associated with production are for engineers and technicians, where there is a shortage in Ukraine. According to a PwC study24 20% of the jobs associated with hydrogen production are for engineers, nearly 40% for technicians, and 30% in corporate roles. These are precisely the areas where there is a shortage of staff in Ukraine (see Chapter "Taking stock of the effect of war"). Some of the roles that require the most hydrogen-specific knowledge are for chemical, commissioning and grid connection engineers, as well as managers and process control technicians, and in jobs related to safety and quality. At least half of the roles would require some general knowledge about hydrogen properties, equipment and safety. Specialised knowledge is required for operation of electrolysis and its cooling system.
There are alternative pools of human capital that could be tapped into. Ukraine and Germany have together agreed to open “Unity Hubs”. These are centres aiming to provide advice to Ukrainians abroad, including support for a voluntary return to Ukraine and help with finding jobs. A post-war programme for (re)training of war veterans in renewable- and hydrogen-related areas could also be considered.
Finance
Producing 2.5 Mtpa of hydrogen would require an investment of about 50% of the 2024 GDP. This level of output would require about 25 GW of electrolysis and either about 45 GW of onshore wind or 125 GW of solar PV. For reference, the total pre-invasion generation capacity was about 44 GW, which plunged to 20 GW in 2024 (see Chapter "Taking stock of the effect of war"). Installing 125 GW of solar PV would take a developed market like the United States more than 4 years at the deployment pace in 2024 (30 GW). This would be approximately equal to ten of the full-scale hydrogen valleys being currently planned. The investment need for such facilities (including renewables) would be in the order of USD 85-90 billion25 with nearly two-thirds of this going to renewables. This expenditure would not happen in a single year, but instead be spread over several years, but notably, this would be roughly equal to half of the USD 180 billion of GDP in 2024. As such, the investment needed for hydrogen alone would be 45-65% higher than the total investment needed to reconstruct the entire energy system after the war (see Chapter "Taking stock of the effect of war").

Interest payments could amount to USD 165-175 billion (in nominal terms) with a cost of capital of 15%. Once the war ends, the cost of capital is expected to return to lower levels as the country risk premium decreases. Assuming a cost of capital of 15%26 the total interest payments (assuming a lifetime of 25 years) would amount to nearly twice the investment needs for hydrogen production. Annual interest payments could reach a peak of more than USD 12 billion. In comparison, direct investment in the entire Ukrainian economy was USD 7.5 billion in 2021, and gross international reserves were USD 31 billion. Some caveats are, firstly, that the cost of capital will most likely come down as experience is developed, and secondly, the capital expenditure will be carried out over several years with variable WACC, and projects could also be re-financed, meaning that some of the capital might not be exposed to such a high cost of capital. However, the high WACC premium in Ukraine can have a significant effect on annual flows and balance of payment, given the size of the investments required. Moreover, much will depend on how the WACC evolves over time and changes to the country risk premium after the war ends. The WACC might also be lower by the time most of the hydrogen deployment takes place, or if development finance and risk mitigation instruments are used (see Chapter 3. "Unlocking the opportunity - A roadmap for action"). If the WACC were reduced to 5%, the interest payments would be reduced to USD 55‑60 billion.
References
See the annex in the report for a full list of studies estimating the potential.
With a 67% efficiency on a lower heating value basis.
Assuming a hydrogen demand of 55 kg H2 per ton of DRI and an additional 5% for the conversion from direct reduced iron to steel.
The iron ore quality also depends on the company. Some companies (e.g. SevGOK) may supply the iron ore that meets the requirements of the DRI process.
This refers to the global average for iron content of the reserves, while production has a higher content of 62%.
10th and 90th percentile based on 32 scenarios.
Renewable Energy Directive, FuelEU Maritime, ReFuelEU Aviation.
Assuming 5 000 full load hours per year.
From agricultural residues, cultivated crops, woody biomass, manure, organic waste and sewage.
50% of the water resources are in the Danube basin (bordering the European Union), which means other parts of the country have an even smaller share of resources.
This corresponds to water withdrawal assuming a conservative estimate of 60 L/kg (10 L/kg for the process side and 50 L/kg for cooling). The water used for cooling is not consumed in the process and can be used afterwards for other purposes. Other studies have estimates of 26-32 L/kg in total.
Upper bound includes offshore wind.
These are soils rich in organic carbon and with high fertility used for intensive agriculture and susceptible to degradation. Ukraine holds about 5% of the global black soil area.
This potential value and the average capacity factor comparison exclude resources with a capacity lower than 12.5% for solar PV and 20% for onshore wind since those resources might be economically unattractive.
This is based on the renewable potential from literature, while the 14.7 Mtpa from Figure 2.5 is from this report. See the annex for details.
The WACC for solar PV and onshore wind in Germany was 1.3% (real after-tax terms). This is corrected by expectations of changes in risk-free rate which are assumed to follow the 10-year US treasury bonds. This results in a WACC premium of 2.2%.
The transport capacity of a natural gas pipeline declines to about 80% when transporting hydrogen. Hydrogen has roughly a third of the volumetric heating value of natural gas, but it also has a volumetric energy density that is eight times lower (due to the lower molecular weight), so a larger volumetric flow (of about three times) can be transported for hydrogen while achieving a similar pressure drop (and therefore, pipeline capacity).
Ukraine is also interconnected with Moldova, but Moldova is not part of the European Union.
Assuming sizes of 3 000 t/d of ammonia and 2 Mt of steel production.
This is assuming full utilisation, which might not be the case during early stages of the market.
The draft strategy had 1.3 Mtpa in 2035 and 3 Mtpa in 2050, while plans presented during the Ukraine Recovery Conference 2023 were more ambitious, with production of 1.5 Mtpa by 2032 and 7.2 Mtpa by 2050 (with nearly half for export).
There are several mixed factors. Technology learning will lead to lower costs over time, cost of capital might change over time with central banks’ interest rates, early production will most likely be through long-term contracts locking in some of the higher costs, so this value is used just to have an indication of the order of magnitude.
These are the four categories covered in this analysis. There are other categories like trade, professional and business services and industry associations, among others, which are excluded. These vary depending on the technology and market. For example, in the United States, for solar PV, almost a third of the workforce worked in these areas.
Based on the oil and gas industry in Australia.
Assuming 5 000 hrs/yr for the electrolyser, 67% efficiency on a lower heating value basis, CAPEX and average capacity factors from (DEA, 2024). Solar PV with USD 680/kW in 2023 and 993 full-load hours and onshore wind with USD 1 250/kW and 2 803 full-load hours. CAPEX decreases over time with deployment. Renewable capacity is sized based on operating hours, efficiency losses and targeted hydrogen volume.
This is higher than the 12% seen pre-invasion for renewables due to an additional technology risk premium for electrolysis and additional hydrogen risks like offtake and infrastructure.
Reference 1
See the annex in the report for a full list of studies estimating the potential.
Reference 2
With a 67% efficiency on a lower heating value basis.
Reference 3
Assuming a hydrogen demand of 55 kg H2 per ton of DRI and an additional 5% for the conversion from direct reduced iron to steel.
Reference 4
The iron ore quality also depends on the company. Some companies (e.g. SevGOK) may supply the iron ore that meets the requirements of the DRI process.
Reference 5
This refers to the global average for iron content of the reserves, while production has a higher content of 62%.
Reference 6
10th and 90th percentile based on 32 scenarios.
Reference 7
Renewable Energy Directive, FuelEU Maritime, ReFuelEU Aviation.
Reference 8
Assuming 5 000 full load hours per year.
Reference 9
From agricultural residues, cultivated crops, woody biomass, manure, organic waste and sewage.
Reference 10
50% of the water resources are in the Danube basin (bordering the European Union), which means other parts of the country have an even smaller share of resources.
Reference 11
This corresponds to water withdrawal assuming a conservative estimate of 60 L/kg (10 L/kg for the process side and 50 L/kg for cooling). The water used for cooling is not consumed in the process and can be used afterwards for other purposes. Other studies have estimates of 26-32 L/kg in total.
Reference 12
Upper bound includes offshore wind.
Reference 13
These are soils rich in organic carbon and with high fertility used for intensive agriculture and susceptible to degradation. Ukraine holds about 5% of the global black soil area.
Reference 14
This potential value and the average capacity factor comparison exclude resources with a capacity lower than 12.5% for solar PV and 20% for onshore wind since those resources might be economically unattractive.
Reference 15
This is based on the renewable potential from literature, while the 14.7 Mtpa from Figure 2.5 is from this report. See the annex for details.
Reference 16
The WACC for solar PV and onshore wind in Germany was 1.3% (real after-tax terms). This is corrected by expectations of changes in risk-free rate which are assumed to follow the 10-year US treasury bonds. This results in a WACC premium of 2.2%.
Reference 17
The transport capacity of a natural gas pipeline declines to about 80% when transporting hydrogen. Hydrogen has roughly a third of the volumetric heating value of natural gas, but it also has a volumetric energy density that is eight times lower (due to the lower molecular weight), so a larger volumetric flow (of about three times) can be transported for hydrogen while achieving a similar pressure drop (and therefore, pipeline capacity).
Reference 18
Ukraine is also interconnected with Moldova, but Moldova is not part of the European Union.
Reference 19
Assuming sizes of 3 000 t/d of ammonia and 2 Mt of steel production.
Reference 20
This is assuming full utilisation, which might not be the case during early stages of the market.
Reference 21
The draft strategy had 1.3 Mtpa in 2035 and 3 Mtpa in 2050, while plans presented during the Ukraine Recovery Conference 2023 were more ambitious, with production of 1.5 Mtpa by 2032 and 7.2 Mtpa by 2050 (with nearly half for export).
Reference 22
There are several mixed factors. Technology learning will lead to lower costs over time, cost of capital might change over time with central banks’ interest rates, early production will most likely be through long-term contracts locking in some of the higher costs, so this value is used just to have an indication of the order of magnitude.
Reference 23
These are the four categories covered in this analysis. There are other categories like trade, professional and business services and industry associations, among others, which are excluded. These vary depending on the technology and market. For example, in the United States, for solar PV, almost a third of the workforce worked in these areas.
Reference 24
Based on the oil and gas industry in Australia.
Reference 25
Assuming 5 000 hrs/yr for the electrolyser, 67% efficiency on a lower heating value basis, CAPEX and average capacity factors from (DEA, 2024). Solar PV with USD 680/kW in 2023 and 993 full-load hours and onshore wind with USD 1 250/kW and 2 803 full-load hours. CAPEX decreases over time with deployment. Renewable capacity is sized based on operating hours, efficiency losses and targeted hydrogen volume.
Reference 26
This is higher than the 12% seen pre-invasion for renewables due to an additional technology risk premium for electrolysis and additional hydrogen risks like offtake and infrastructure.